
Seen something unusual? MAKE A REPORT
Seen something unusual? MAKE A REPORT

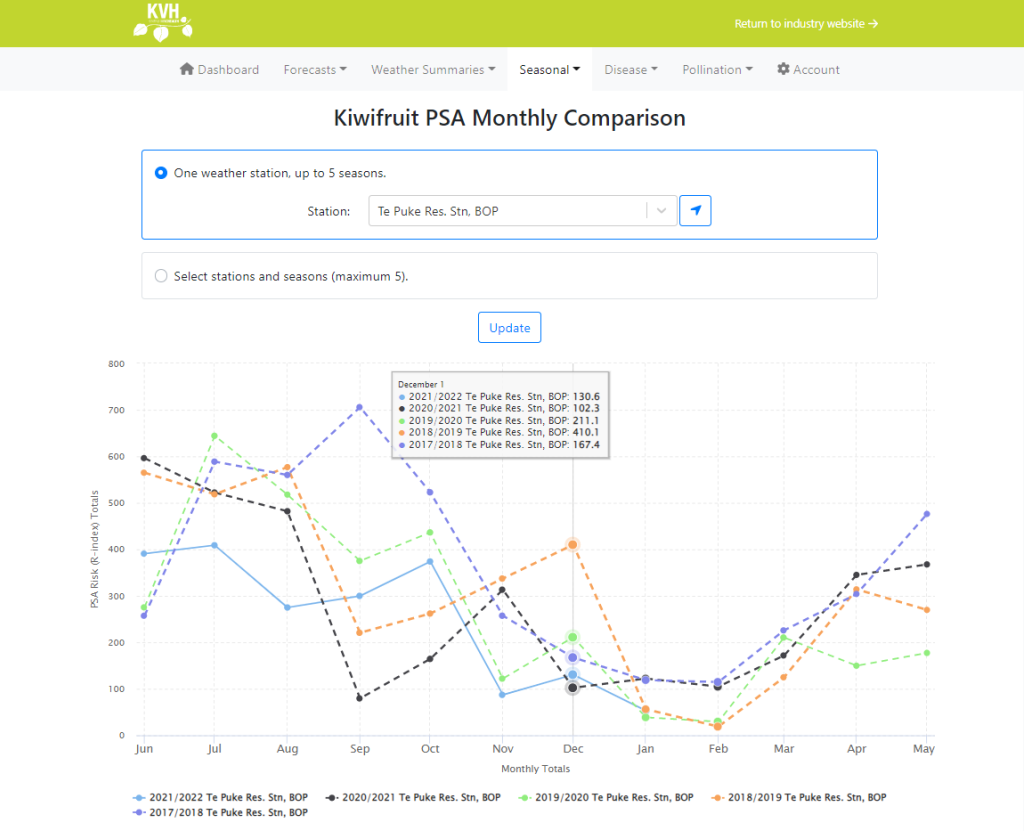
Image: The Psa risk model calculates an R-index for each day, which represents the daily infection risk for the environmental conditions that day. This daily R-index is accumulated into a total for each month to give an indication of how infection risk is trending over time.
We’ve added a great new tool into the Weather & Disease Portal, enabling you to do a comparison of monthly Psa infection risk, between any season and any weather station.
Monthly Psa infection risk is simply the R-index, or infection risk, calculated for each day of that month, added together. A month with a higher monthly total will have more favourable conditions for infection and therefore greater disease risk pressure than a month with a lower total.
Previously, the Weather & Disease Portal allowed comparisons across months and seasons for a single weather station only. The great new functionality means you can now build your own list of station and season combinations allowing you to compare infection risk across properties in different areas and across different years.
The clear, simple, easy to understand data is designed to help inform Psa decision making.
Growers and orchard managers can - based on Psa history on-orchard - adjust their Psa management strategies to ensure they are appropriate for each orchard location.
The monthly Psa risk comparison tool can be found within the Weather & Disease Portal, under the ‘seasonal’ tab. You can choose up to five seasons, and up to five stations.
If you haven’t already registered to access the portal, you can do so on the KVH website here.
KVH investigates reports of unusual symptoms to identify and manage any biosecurity risks.
The KVH portal is now the Zespri Weather & Disease Portal. Access all the weather tools you're familiar with.