
Seen something unusual? MAKE A REPORT
Seen something unusual? MAKE A REPORT

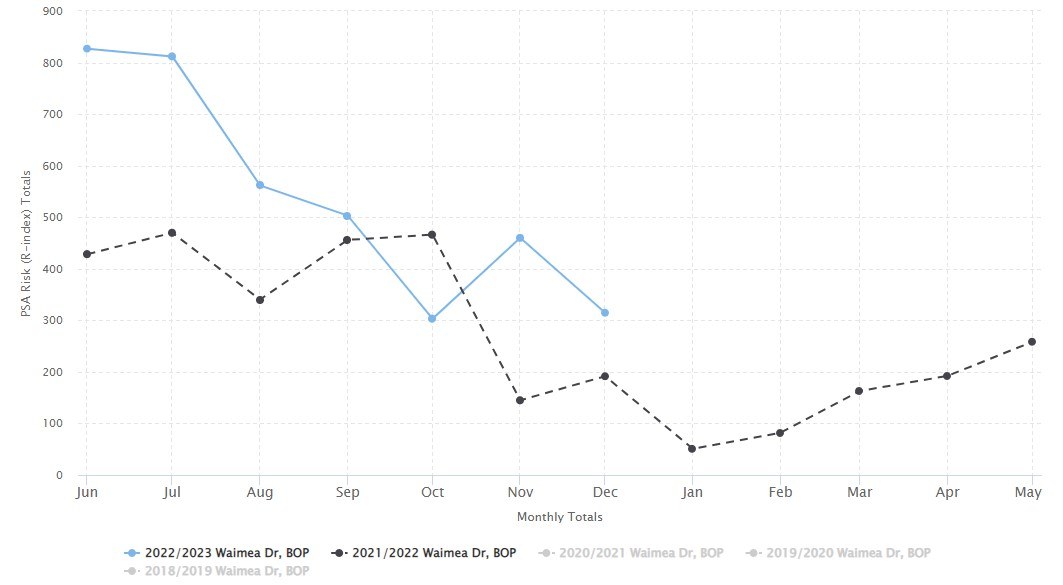
The Psa monthly comparison tool in the Weather & Disease Portal gives growers an indication of the monthly Psa infection risk pressure in comparison to previous seasons and times of the year.
This tool accumulates daily infection risk related to records from each weather station and provides monthly totals that show how infection risk is trending over time. Higher monthly values indicate greater disease pressure.
This season, Psa risk levels for October 2022 were on par or lower than October 2021 for all stations except in Gisborne and Whanganui. However, for November (85% of stations) and December (94% of stations) infection risk was higher and often considerably higher than levels seen in 2021. This increase links to the prolonged rainfall periods experienced across the country through this period (rain being a key driver of Psa infection).
The tool also shows how Psa risk falls away through November and December as temperatures rise, and though this trend was also seen in 2022, risk did not drop to the lower levels typical of previous years.
For the majority (80% of stations), December risk remained similar to levels typical of the cooler months - April and May. Maungatapere, Waihi, Waimea Drive Te Puke and Te Teko stations recorded the highest weather related Psa risk through December. Growers can use the data from this tool to inform monitoring and spray decisions for their orchards.
Growers with young plants and particularly those on sites with more Psa effects, or affected by stormy conditions, are recommended to check for signs of infection such as recent Psa leaf-spotting.
If signs of infection are found, ensure protective cover is in place ahead of any upcoming high rainfall periods. Growers developing replacement canopies may also want to monitor for symptoms as young growth is more at risk.
Sprays should only be applied in good drying conditions and outside of fruit sensitive periods. A proactive approach avoids the risk of inoculum building up and spreading to new areas of the orchard.
The Weather & Disease Portal is accessible via the KVH website. Log in here to access the portal or view our handy 'how to login' guide.
Image below: Data from the Psa monthly comparison tool from Waimea Drive Te Puke.
KVH investigates reports of unusual symptoms to identify and manage any biosecurity risks.
The KVH portal is now the Zespri Weather & Disease Portal. Access all the weather tools you're familiar with.